Analyzing Suspicious IP Addresses
Suspicious connection requests are a common occurrence for Linux system administrators. From who and where are these suspicious requests originating?


Table of Contents
- Background
- IP Address Identification with MaxMind GeoIP2 Precision Web Services
- Data Exploration
- Findings
Managing an Ubuntu server is a rewarding endeavor that requires constant learning, esoteric knowledge of the Linux kernel, working memory of dozens of commands, and proactive intervention. Before diving into the analysis, let’s first define what Ubuntu, SSH, Apache, Fail2Ban, and MaxMind are used for in this context. If you are already familiar with these technologies, feel free to skip ahead.
Ubuntu
![]()
Ubuntu server is a popular distribution of a linux server operating system - there is no GUI - ultimately, all inputs are through the command-line interface (CLI) via keyboard. Ubuntu server provides a large community and resource pool which is helpful for beginners. The wide-spread support also means there are few package availability/compatibility issues. You can learn more about Ubuntu server here. Typically, physical access to a server is impractical (traveling) if not impossible (provisioned by Amazon Web Services, Microsoft Azure, etc.). To overcome this, there are web-friendly tools available.
SSH & Apache
In either the impractical or the impossible case, you will need a way to connect to your server from a distance. Secure shell (SSH) provides, as the name suggests, a secure method for remotely connecting to your server. Remote access is a powerful way to configure or monitor your server using the command-line interface. If you are using your server as a webserver or webhost, then there is a strong chance you are using Apache, NGINX, or a similar host. With a properly configured webserver, you can serve content (files, documents, pictures, videos, etc.) to your users. You can learn more about SSH here and Apache (also known as httpd) here.
Malicious Users
At this point, the pair of information security pillars - authentication and authorization - becomes critical. Since you can access the server remotely, theoretically, anyone else can access the server because the server has no upfront way of detecting whether you or someone else initiated the incoming connection. Fortunately, both SSH and Apache log failed connection attempts and record the originating IP address. Understanding the log data is a key motivation for this project.
An example of a suspicious and possibly malicious connection request in the log files may look something similar to the following:
Dec 13 05:28:00 servername sshd[123]: Failed password for invalid user administrador from 139.59.171.172 port 32940 ssh2
Dec 13 06:03:39 servername sshd[123]: Failed password for invalid user deploy from 167.99.5.18 port 54628 ssh2
Dec 13 06:09:34 servername sshd[123]: Failed password for invalid user admin from 231.42.132.19 por 42192 ssh2
As you can see, the log files are serially arranged but there is hidden structure. We’ll see this again after we review Fail2Ban log files. While we can read these one at a time, a given log file may contain thousands of records, limiting the feasibility of any human to interpret and identify patterns. Best to let a computer do the heavy lifting here.
Fail2Ban
Fail2ban is widely used to automate the access revoking process. In short, if an IP address initiates too many failed connections within a specified window of time (e.g., 10 minutes, 24 hours, etc.), then the IP address will be banned (known in fail2ban terms as being placed in a ‘jail’). Each service that is monitored has a jail to track banned IP addresses (i.e., one for SSH, one for Apache). This tool is useful for securing your server but can also be leveraged for deeper analysis. Using the history of failed connections and logged IP addresses, a better understanding of who is trying to access your server can be developed.
An example of fail2ban log files:
2019-01-28 07:01:57,512 fail2ban.actions        [1224]: NOTICE  [sshd] Ban 180.179.174.247
2019-01-28 09:47:12,368 fail2ban.actions        [1224]: NOTICE  [sshd] Ban 222.124.12.57
2019-01-28 10:21:15,311 fail2ban.actions        [1224]: NOTICE  [sshd] Ban 190.71.18.91
MaxMind GeoIP2 Precision Web Services
![]()
In order to take advantage of the list of banned IP addresses, we can supplement the data with more data. MaxMind is a service that, for a modest fee, provides data about IP addresses. For each IP address, MaxMind can provide the continent, country, city, and detail about the organization or user. MaxMind is used by many organizations to enhance their IP address analysis capabilities. You can better detect hacking attempts, fraud, phishing, or better understand where your web traffic is originating. The following analysis dives into the process of acquiring, cleaning, and exploring the IP address data from fail2ban and MaxMind while focusing on failed SSH authentication requests.
The MaxMind GeoIP2 API offers 3 primary tiers of information: Country, City, and Insights. For the purposes of this analysis, we will be using the more costly but more detailed Insights set of fields. Additional information about MaxMind geoIP services can be found in the documentation.
IP Identification with MaxMind API
Getting data from Fail2Ban
After connecting to the server, we can fetch a list of fail2ban jails by using the following command:
sudo fail2ban-client status
The following command will retrieve a list of IP addresses banned in the jail specified in the last argument:
sudo fail2ban-client status sshd
At this point, we now have a long list of space-separated IP addresses. We still have the fail2ban logs and can see what resource each IP address was trying to access, using which username, at which date and time. Each line in the log file represents an IP address being banned or re-banned. The date and time of the action taken is recorded with each line. However, the data are not delimited in a convenient way. Given that our dataset only contains ~10000 lines, we can use a popular spreadsheet tool to process the data. Alternatively, you can accomplish the same tasks in python using str.split().
Fetch IP address details using MaxMind API
Once you have the list of IP addresses separated into values, you can programmatically call the MaxMind API to get additional details for each IP address. First, let’s get everything set up to make the calls correctly.
 1# Load packages
 2import numpy as np
 3import pandas as pd
 4import json
 5from geoip2 import webservice
 6
 7# Set up MaxMind client with account ID and API key
 8client = webservice.Client(acct_id, 'AP1K3Y')
 9
10# Load unique IP addresses
11unique_ips = pd.read_csv('./data/unique_ips.csv')
12
13# What type of object is stored in the Unique_IP column
14type(unique_ips['Unique_IP'][0])
The result of the preceding code cell in the Jupyter notebook is str. Each IP address has been read in as a string, which will be sufficient for our analysis. If you need advanced data types for your IP addresses, look into the ipaddress library.
1# How many unique IP addresses do we have?
2len(unique_ips['Unique_IP'])
As expected, we have 4717 unique IP addresses.
1# Create test dataframe with just 5 IP addresses
2# to reduce upfront API calls
3test = unique_ips.head(5)
4
5test| Unique_IP | |
|---|---|
| 0 | 71.179.163.188 |
| 1 | 193.164.108.28 |
| 2 | 5.196.70.227 |
| 3 | 128.71.236.250 |
| 4 | 41.223.4.155 |
The table above provides the first five rows of the unique_ips dataframe. The dataset currently contains only IP addresses - not a very rich dataset. In order to supplement the data, we will rely on the MaxMind GeoIP2 Precision API.
First we define a function (and two helper functions) to fetch details for each IP address. The primary function of note is the get_all_ip_details() function as it takes in a dataframe, boolean, and a string. The boolean indicates whether a file should be created and the string indicates where the file should be written. Defining a function allows us to test the behavior of the API, which does have costs per request, without sending every IP address. If something does go wrong, we have consumed fewer requests. In fact, the network connection failed on the first full attempt which required adding the try/except blocks. Using pythonic assignment and evaluation in line 42, the function returns a new dataframe with the MaxMind insights for each IP address and a list of bad IP addresses (fortunately there are none).
Note: Outside of a small fee per request, MaxMind does not throttle the number of API requests that can be made in a given time period.
 1# Define function that retrieves IP details for a single IP address
 2def get_ip_details_from_maxmind(ip):
 3    # Call maxmind and get insights
 4    response = client.insights(ip)
 5    return response
 6
 7# Define function that returns a flattened json object in pandas dataframe
 8def flatten_ip_details_json(ipjson):
 9    # Use pandas to flatten the json
10    flat_json = pd.io.json.json_normalize(ipjson.raw)
11    return flat_json
12
13# Define outer function to process a dataframe of IP addresses
14def get_all_ip_details(df, write_to_file = False, filepath='./data/unique_ips_full.csv'):
15    # Create empty shell dataframe
16    new_df = pd.DataFrame()
17    failed_ips = []
18
19    # Loop through each IP address
20    for index, row in df.iterrows():
21        # Print status of loop
22        if index % 500 == 0:
23            print(str(index))
24
25        # Try to get IP details
26        try:
27            response = get_ip_details_from_maxmind(row['Unique_IP'])
28            flat_json = flatten_ip_details_json(response)
29
30            # Append the new row and combine overlapping columns
31            new_df = pd.concat([new_df, flat_json], sort=False)
32
33        # Throw exception and print offending IP address
34        except:
35            failed_ips.append(row['Unique_IP'])
36            print(row['Unique_IP'] + " failed.")
37
38    # Write to file if requested
39    if write_to_file:
40        new_df.to_csv(filepath, sep=',', encoding='utf_8')
41
42    return new_df, failed_ips
As alluded to above, before requesting data for all IP addresses, it is imperative that we test the custom functions with the subset of IP addresses contained in the test dataframe.
1# Test functions with 10 IP addresses
2test_details, failed_test_ips = get_all_ip_details(test, True, './data/test_unique_ips_2.csv')
Once the code has been confirmed to be working with a test sample, we can request the IP address details from MaxMind for all of the 4717 unique IP addresses.
1# Get details for all IP addresses
2unique_ip_details, failed_ips = get_all_ip_details(unique_ips, True)Now that the data have been retrieved, we can store the data in a CSV file so that we no longer have to make requests to MaxMind. If you are concerned about performance while reading and writing files, consider using a feather file. Since the complete dataset is only about 4717x60, a CSV is sufficient. Saving data to avoid API calls is important as it can save time and money.
 1# imports
 2import numpy as np
 3import pandas as pd
 4import matplotlib.pyplot as plt
 5import seaborn as sns
 6
 7# Read in the CSV file of unique IP addresses
 8uip_df = pd.read_csv('./data/unique_ips_full.csv', sep=',', encoding='utf_8')
 9
10uip_df.head()| city.confidence | city.geoname_id | city.names.en | continent.code | continent.geoname_id | continent.names.de | continent.names.en | continent.names.es | continent.names.fr | ... | registered_country.is_in_european_union | traits.is_hosting_provider | city.names.de | city.names.fr | city.names.ja | city.names.pt-BR | city.names.ru | city.names.es | city.names.zh-CN | traits.is_anonymous_vpn | |
|---|---|---|---|---|---|---|---|---|---|---|---|---|---|---|---|---|---|---|---|---|
| 0 | 20.0 | 4373861.0 | Windsor Mill | NaN | 6255149 | Nordamerika | North America | Norteamérica | Amérique du Nord | ... | NaN | NaN | NaN | NaN | NaN | NaN | NaN | NaN | NaN | NaN |
| 1 | 10.0 | 2641731.0 | Newark on Trent | EU | 6255148 | Europa | Europe | Europa | Europe | ... | True | NaN | NaN | NaN | NaN | NaN | NaN | NaN | NaN | NaN |
| 2 | NaN | NaN | NaN | EU | 6255148 | Europa | Europe | Europa | Europe | ... | True | True | NaN | NaN | NaN | NaN | NaN | NaN | NaN | NaN |
| 3 | 50.0 | 472045.0 | Voronezh | EU | 6255148 | Europa | Europe | Europa | Europe | ... | NaN | NaN | Woronesch | Voronej | ヴォロネジ | Voronezh | Воронеж | NaN | NaN | NaN |
| 4 | 30.0 | 160263.0 | Dar es Salaam | AF | 6255146 | Afrika | Africa | África | Afrique | ... | NaN | NaN | Daressalam | Dar es Salam | ダルエスサラーム | Dar es Salaam | Дар-эс-Салам | Dar es-Salam | 达累斯萨拉姆 | NaN |
5 rows × 66 columns
MaxMind returns columns that are not needed mainly because they are translated columns (from the ‘en’glish version). Using pandas, these columns can be dropped easily.
 1# Define columns that can be dropped
 2drop_columns = ([
 3    'city.names.es',
 4    'city.names.pt-BR',
 5    'city.names.zh-CN',
 6    'city.names.fr',
 7    'city.names.de',
 8    'city.names.ja',
 9    'city.names.ru',
10    'registered_country.names.de',
11    'registered_country.names.es',
12    'registered_country.names.fr',
13    'registered_country.names.ja',
14    'registered_country.names.pt-BR',
15    'registered_country.names.ru',
16    'registered_country.names.zh-CN',
17    'country.names.ja',
18    'country.names.de',
19    'country.names.es',
20    'country.names.fr',
21    'country.names.ru',
22    'country.names.pt-BR',
23    'country.names.zh-CN',
24    'continent.names.ja',
25    'continent.names.de',
26    'continent.names.es',
27    'continent.names.fr',
28    'continent.names.ru',
29    'continent.names.pt-BR',
30    'continent.names.zh-CN'
31])
32
33# Drop unneeded, repetitive columns
34uip_df = uip_df.drop(drop_columns, axis=1)
As part of the learning process, it is helpful to know how much data is missing. If this were a predictive analytics project, imputation methods could be considered, but we are focused primarily on describing the data that we do have.
1# Find percent missing for each column and create a bar chart
2uip_percent_missing = uip_df.isnull().sum() * 100 / len(uip_df)
3uip_percent_missing.sort_values().plot(kind='barh', figsize=(10,15), title="Missing Data for IP Details")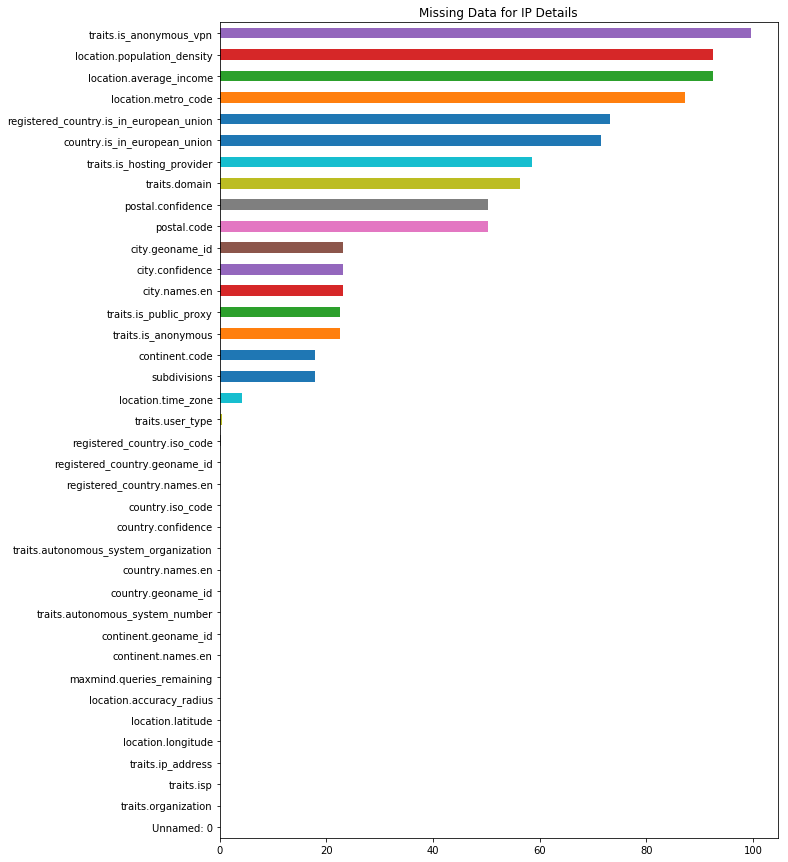
Two observations jump out immediately regarding missing data. Continent level information is available for all records, but in some cases country and city details are missing. Also, some values have extremely high missingness (e.g., greater than 90%) which could render those columns almost useless while other attributes have no missing values.
1# Read in the original data
2ipactions_df = pd.read_csv('./data/f2b_actions_121918.csv')
3
4# Drop unneeded columns
5drop_columns = ['Group', 'Num', 'Type', 'Jail', 'Ban_IP', 'Restore_IP']
6ipactions_df = ipactions_df.drop(drop_columns, axis=1)
7
8ipactions_df.head()| Source | Time | Action | Harmonized_IP | |
|---|---|---|---|---|
| 0 | /var/log/fail2ban.log:2018-12-16 | 06:33:23,594 | Ban | 71.179.163.188 |
| 1 | /var/log/fail2ban.log:2018-12-16 | 06:37:20,119 | Ban | 193.164.108.28 |
| 2 | /var/log/fail2ban.log:2018-12-16 | 06:48:45,354 | Ban | 5.196.70.227 |
| 3 | /var/log/fail2ban.log:2018-12-16 | 06:48:47,870 | Ban | 128.71.236.250 |
| 4 | /var/log/fail2ban.log:2018-12-16 | 06:49:51,972 | Ban | 41.223.4.155 |
1# Find percent missing for each column and create a bar chart
2ipa_percent_missing = ipactions_df.isnull().sum() * 100 / len(uip_df)
3ipa_percent_missing.sort_values().plot(kind='barh', figsize=(5,1.5), title="Missing Data for IP Actions")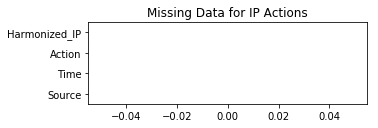
Notice that there is no missing data in our log files (which matches our expectations).
1# Join the unique data with the actions data
2ipaction_full = ipactions_df.merge(uip_df, left_on='Harmonized_IP', right_on='traits.ip_address')
3ipaction_full.head()| Source | Time | Action | Harmonized_IP | Unnamed: 0 | city.confidence | city.geoname_id | city.names.en | continent.code | continent.geoname_id | ... | traits.ip_address | traits.is_anonymous | traits.is_public_proxy | traits.isp | traits.organization | traits.user_type | country.is_in_european_union | registered_country.is_in_european_union | traits.is_hosting_provider | traits.is_anonymous_vpn | |
|---|---|---|---|---|---|---|---|---|---|---|---|---|---|---|---|---|---|---|---|---|---|
| 0 | /var/log/fail2ban.log:2018-12-16 | 06:33:23,594 | Ban | 71.179.163.188 | 0 | 20.0 | 4373861.0 | Windsor Mill | NaN | 6255149 | ... | 71.179.163.188 | True | True | Verizon Fios Business | Verizon Fios Business | business | NaN | NaN | NaN | NaN |
| 1 | /var/log/fail2ban.log:2018-12-16 | 21:16:56,733 | Restore | 71.179.163.188 | 0 | 20.0 | 4373861.0 | Windsor Mill | NaN | 6255149 | ... | 71.179.163.188 | True | True | Verizon Fios Business | Verizon Fios Business | business | NaN | NaN | NaN | NaN |
| 2 | /var/log/fail2ban.log:2018-12-16 | 06:37:20,119 | Ban | 193.164.108.28 | 0 | 10.0 | 2641731.0 | Newark on Trent | EU | 6255148 | ... | 193.164.108.28 | True | True | Redcentric Managed Solutions Limited | Redcentric Managed Solutions Limited | residential | True | True | NaN | NaN |
| 3 | /var/log/fail2ban.log:2018-12-16 | 21:16:52,959 | Restore | 193.164.108.28 | 0 | 10.0 | 2641731.0 | Newark on Trent | EU | 6255148 | ... | 193.164.108.28 | True | True | Redcentric Managed Solutions Limited | Redcentric Managed Solutions Limited | residential | True | True | NaN | NaN |
| 4 | /var/log/fail2ban.log:2018-12-16 | 06:48:45,354 | Ban | 5.196.70.227 | 0 | NaN | NaN | NaN | EU | 6255148 | ... | 5.196.70.227 | True | True | OVH SAS | OVH SAS | hosting | True | True | True | NaN |
5 rows × 42 columns
Now that we have cleaned and explored our data, we can begin to develop findings and draw conclusions.
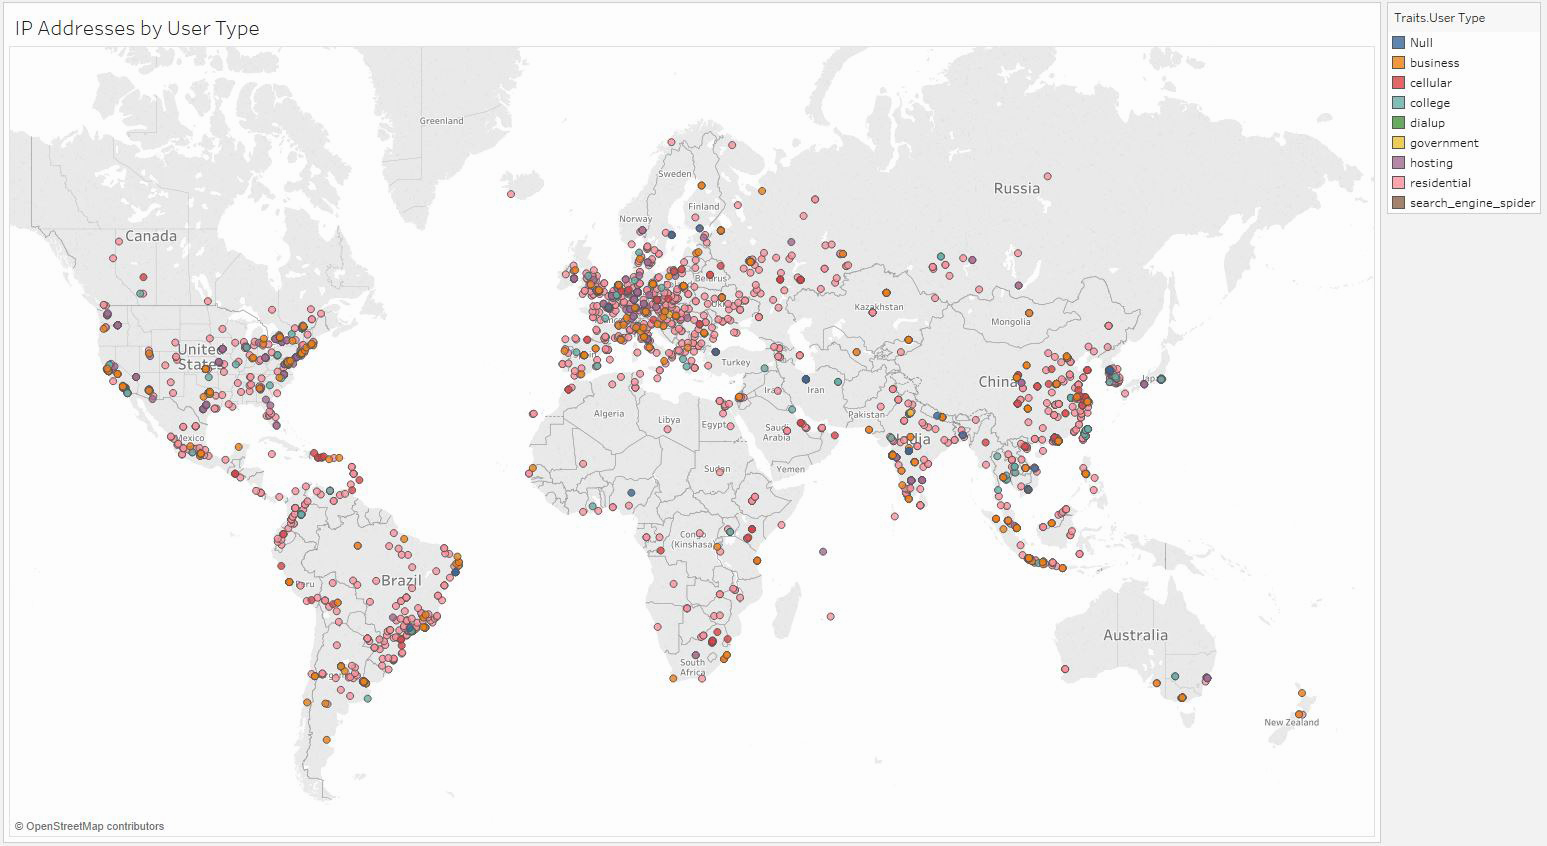
Remember that we started with very basic, text-only log files that were sorted in serial/chronological fashion. We transformed the data into unique IP addresses by cleverly filtering the Fail2Ban logs. We requested additional information about each unique IP address from MaxMind. Then, we cleaned and explored the data to develop familiarity and evaluate which questions could be answered with the newly augmented data set. We now have descriptive information about each IP address including user type, geography, domain or ISP, and country/city of origin. We also have joined the descriptive data for each unique IP address with the log data which contains a time stamp.
With the descriptive data for each unique IP address (the data set without the time stamp), we can plot each IP address based on its estimated latitude and longitude. Once we do, we can see that there are clusters corresponding to countries with large populations and large data centers (western Europe, the United States, Brazil, and China). Additionally, the vast majority of IP addresses belong to businesses, as opposed to universities, governments, or residential users. We can also see that there are a handful of estimated requests with estimated latitudes and longitudes.